Taxes and subsidies
A tax drives a wedge between the price buyers pay and the price sellers receive. The wedge, the quantity and both prices are the same whether the tax is charged to buyers or to sellers Mankiw (2021).
Scenarios
TaxScenario(
    tax_type,
    amount,
    tax_on=TaxOn.PRODUCER,
    anchor_mode=AnchorMode.NONE
)FIXED_TAX or PER_UNIT_TAX: an amount per unit, which shifts a curve by amount; AD_VALOREM_TAX: a rate on the price, which rotates a curve. The two specific taxes give the same equilibrium.
The tax per unit, or the rate for an ad valorem tax (0.35 is 35%); a rate must exceed \(-1\).
Legal incidence: PRODUCER shifts supply up, CONSUMER shifts demand down.
For drawing an ad valorem tax: NONE rotates the curve about its intercept, BASELINE_EQUILIBRIUM about the untaxed equilibrium.
One tax, from principle_viz.policy.tax.
Solving
solve_tax_equilibrium(
    demand,
    supply,
    scenario
)
The taxed market, as a TaxEquilibriumResult: q_star,
consumer_price, producer_price, tax_wedge (their difference) and
tax_revenue (wedge times quantity).
from principle_viz import solve_tax_equilibrium
from principle_viz.policy.tax import TaxOn, TaxScenario, TaxType

tax = TaxScenario(TaxType.PER_UNIT_TAX, 3.0, TaxOn.PRODUCER)
print(solve_tax_equilibrium(demand, supply, tax))
# TaxEquilibriumResult(q_star=2.5, consumer_price=7.5,
#                      producer_price=4.5, tax_wedge=3.0,
#                      tax_revenue=7.5)
TaxOn.CONSUMER gives the same result. An ad valorem tax at rate \(r\) sets
the consumer price to \((1 + r)\) times the producer price.
compare_tax_scenario(
    demand,
    supply,
    scenario
)
The untaxed and taxed markets side by side: baseline_equilibrium,
post_tax, the changes delta_q, delta_p_consumer, delta_p_producer,
and their directions ("left"/"right", "up"/"down").
build_tax_visual_guide(
    demand,
    supply,
    scenario
)
The geometry of the taxed curve: base_curve, taxed_curve,
curve_role ("supply" or "demand") and transform_kind ("shift"
or "rotation"). add_tax_transform() draws from it.
Figures
MarketFigure.add_tax_transform(
    demand,
    supply,
    scenario,
    q_max
)
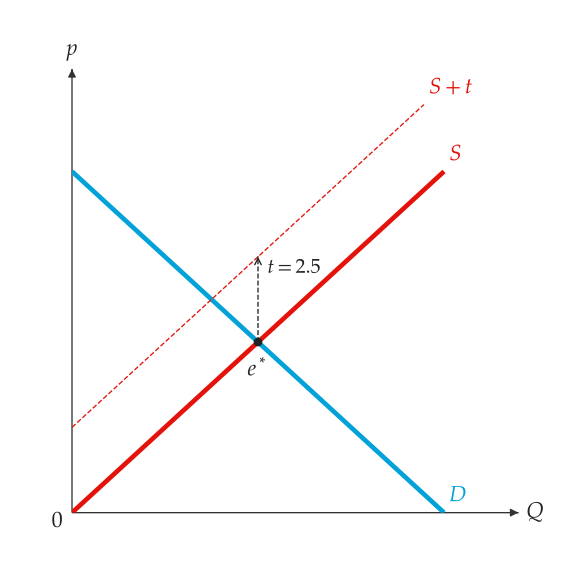
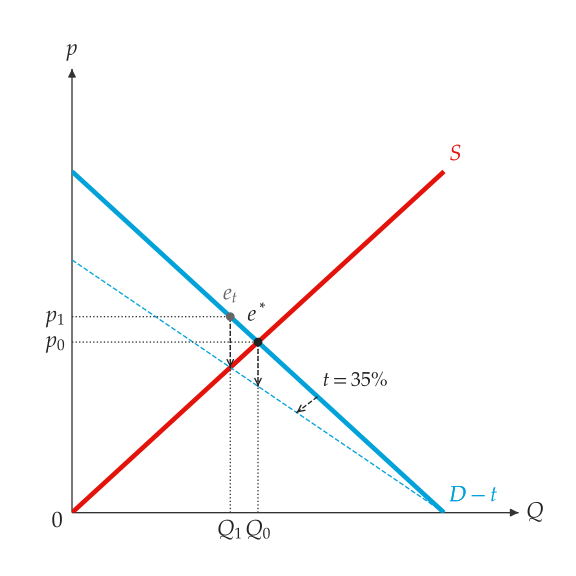
Draw the taxed curve, named \(S + t\) or \(D - t\), with a dashed arrow for the shift or the rotation and the untaxed equilibrium (see A per-unit tax on sellers. and An ad valorem tax on buyers.).
MarketFigure.add_tax_comparison(
    result,
    *,
    brace_side="outside",
    notes=False
)"outside" the axis or "inside" the plot.
Explain each mark beside the axis.
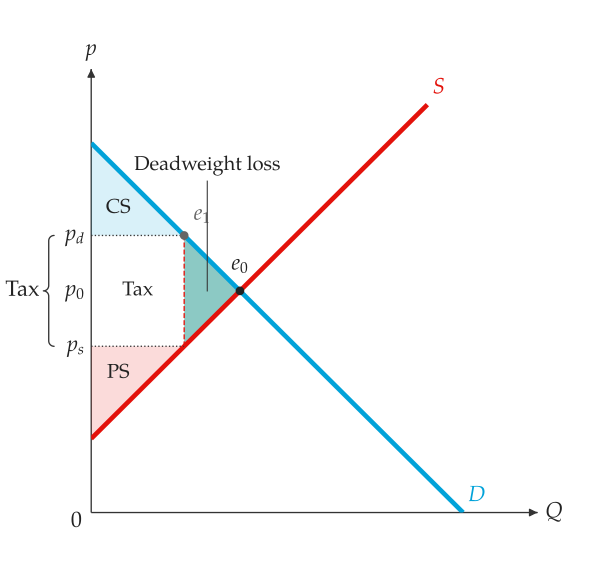
Mark the wedge of a compare_tax_scenario() result: \(p_d\) (buyers),
\(p_0\) (before the tax) and \(p_s\) (sellers) on the price axis, with a "Tax"
brace over \(p_s\) to \(p_d\).
It combines with the welfare regions of Welfare (see Surplus and deadweight loss under a tax.):
from principle_viz import compare_tax_scenario
from principle_viz.welfare.surplus import (
    compare_surplus,
    outcome_from_equilibrium,
    outcome_from_tax,
)

eq = solve_equilibrium(demand, supply)
baseline = outcome_from_equilibrium(eq)
taxed = outcome_from_tax(
    solve_tax_equilibrium(demand, supply, tax)
)
delta = compare_surplus(demand, supply, baseline, taxed)
# 7.5 2.25
print(delta.policy.tax_revenue, delta.deadweight_loss)

fig = MarketFigure(
    x_max=12, y_max=12, title="Welfare Under a Tax"
)
fig.add_curves(demand, supply, q_max=10)
fig.add_welfare(delta.policy)
fig.add_tax_comparison(
    compare_tax_scenario(demand, supply, tax)
)
fig.finalize()
Subsidies
SubsidyScenario(amount, subsidy_to=SubsidyTo.PRODUCER)A per-unit subsidy of amount (non-negative), paid to sellers
(SubsidyTo.PRODUCER) or buyers (SubsidyTo.CONSUMER), from
principle_viz.policy.subsidy.
solve_subsidy_equilibrium(
    demand,
    supply,
    scenario
)
compare_subsidy_scenario(
    demand,
    supply,
    scenario
)
The subsidised market (q_star, consumer_price, producer_price,
subsidy_wedge, government_expenditure), and its comparison with the
free market (baseline_equilibrium, post_subsidy, delta_q,
delta_p_consumer, delta_p_producer). A subsidy of 2 in the market of
Quick start gives a quantity of 5; buyers pay 5, sellers receive 7 and
government expenditure is 10.
MarketFigure.add_subsidy_comparison(
    result,
    *,
    brace_side="outside",
    notes=False
)
Mark the subsidy wedge like the tax wedge, with a "Subsidy" brace, and
name the subsidy's cost. A per-unit subsidy and its deadweight loss. shades only the deadweight loss
(regions=("dwl",)) and hides some labels with visibility
(Labels and layers).
from principle_viz import (
    SubsidyScenario,
    SubsidyTo,
    compare_subsidy_scenario,
)

demand = line_from_inverse(12.0, -1.0)
subsidy = SubsidyScenario(3.0, SubsidyTo.PRODUCER)
comparison = compare_subsidy_scenario(demand, supply, subsidy)
fig = MarketFigure(
    x_max=12,
    y_max=13,
    title="Per-Unit Subsidy",
    visibility={
        "market.subsidy.expenditure.label": False,
        "market.subsidy.wedge.label": False,
        "market.subsidy.wedge.mark.p_0": False,
        "market.subsidy.wedge.brace": False,
    },
)