Quick Start
Every output below comes from running the code with mosaickit 0.5.1.
Build a diagram from layers
A Canvas holds layers. quadrant_axes(10, 10) supplies the two axes, and each add() call appends one layer.
from mosaickit import (
    Canvas,
    Fill,
    FillLayer,
    MarkerLayer,
    PathLayer,
    Stroke,
    TextLayer,
    quadrant_axes,
)

canvas = Canvas().extend(quadrant_axes(10, 10))
canvas.add(
    FillLayer(
        [(1, 1), (1, 7), (8, 1)],
        fill=Fill(color="#377EB8", opacity=0.12),
        z_index=-1,
    )
)
canvas.add(
    PathLayer(
        [(1, 8), (2, 5), (4, 3), (7, 1.5), (9, 1)],
        stroke=Stroke(color="#984EA3", width=2),
        id="curve",
    )
)
canvas.add(MarkerLayer([(4, 3)], id="point"))
canvas.add(TextLayer((4, 3), "A", offset=(8, 8)))
canvas.save("diagram.svg")

scene = canvas.snapshot()
print(type(scene).__name__, len(scene.layers), "layers")
Output:
The six layers are the two axes plus the four you added. canvas.snapshot() returns an immutable Scene, so you can
inspect what will be drawn without rendering it.
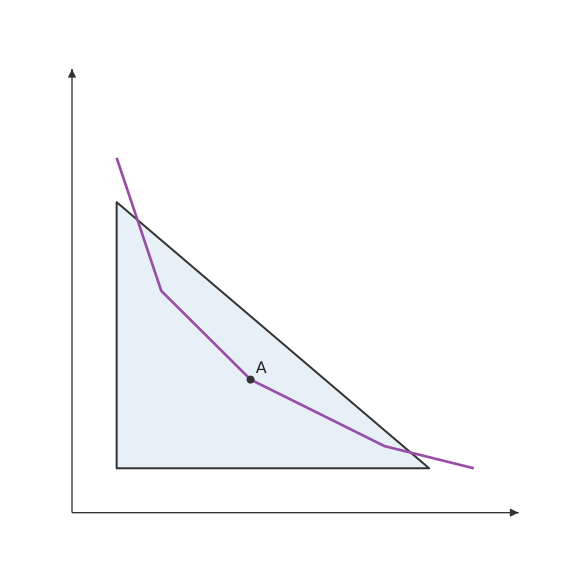
save() picks the format from the file extension: PNG, SVG and PDF use the built-in Matplotlib renderer.
Sweep a parameter across a grid
A Parameter can stand in for a coordinate. CanvasGrid.sweep renders the same template once per value.
from mosaickit import Canvas, CanvasGrid, Parameter, TextLayer, quadrant_axes

position = Parameter("position", value_type=float)
template = Canvas().extend(quadrant_axes(10, 10))
template.add(TextLayer((position, 5), "moving"))

values = position.values([1.0, 3.0, 5.0])
CanvasGrid.sweep(template, values, cols=3).save("sweep.svg")
print("wrote sweep.svg")
Output:
Animation.sweep(template, values, fps=2).save("sweep.gif") turns the same template into a GIF (see
Installation for GIF and MP4 requirements).