principle-viz
principle-viz is a Python package for Principles of Economics market analysis and diagrams. It focuses on
linear demand and supply models, with separate modules for solving, policy, welfare decomposition and plotting.
| Documented version | 0.10.0 |
| Python | 3.10 or later |
| Depends on | mosaickit (>=0.5.1,<0.6.0) |
| Command line | principle-viz |
| Source | github.com/EconViz/principle-viz |
| License | MIT |
What it covers
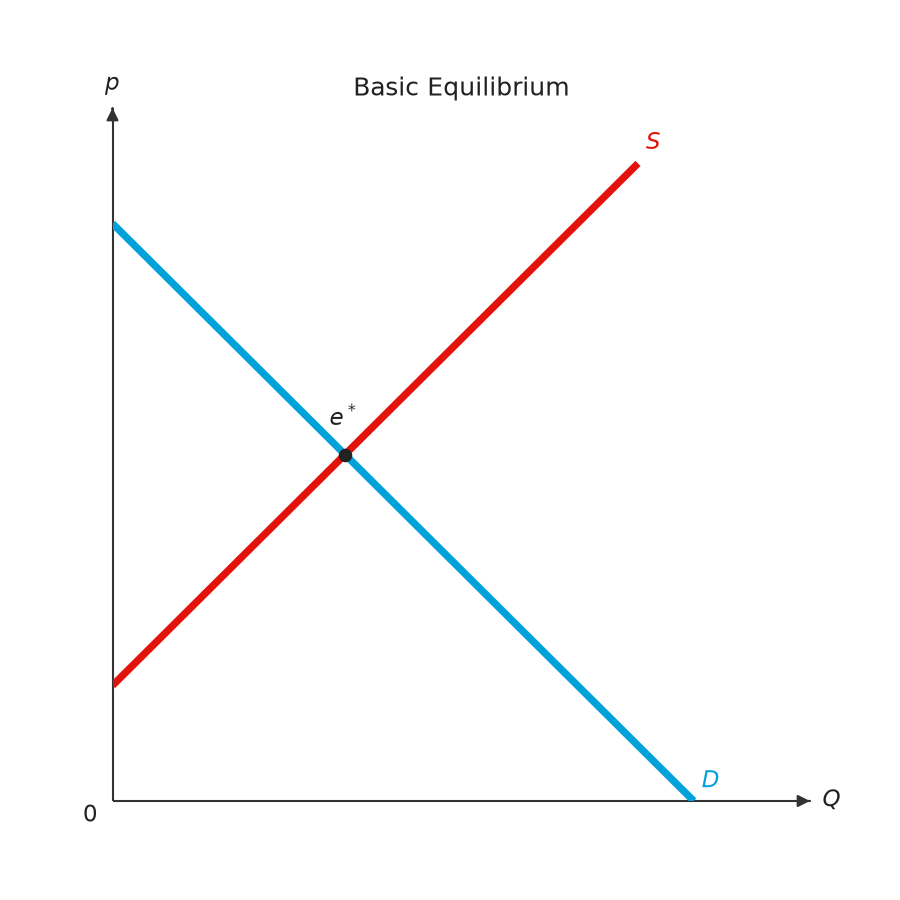
- Market equilibrium from linear demand and supply, or from discrete unit schedules
- Comparative statics: shifts of demand or supply, and the move from the old equilibrium to the new one
- Taxes (fixed, per-unit, ad valorem, on buyers or sellers) and subsidies
- Price ceilings, price floors and the minimum wage
- Welfare decomposition: consumer and producer surplus, tax revenue, deadweight loss
- International trade (free trade, tariffs, quotas), externalities, common resources, public goods, loanable funds, the production possibilities frontier and elasticity
- Market demand and supply as the horizontal sum of individual curves or schedules
- Textbook-style figures built on mosaickit
- A command line interface with JSON output
Next steps
-
Installation
Install the package with pip or uv.
-
Quick start
Solve a market, compare a tax, and draw a figure.