Parameters, grids and animation
Parameters and expressions
A layer coordinate may be an expression in named parameters instead of a number. The resulting scene describes a family of diagrams, one for each set of parameter values. Binding selects one diagram from that family.
Parameter(name, value_type=None)A named placeholder. With value_type set, a bound value must be an
instance of it; every bound value must be hashable. values(seq) returns
ParameterValues, checking each value at once.
Constant(value)Immutable expression trees. Parameters and constants combine with +,
-, *, /, **, unary - and the comparisons <, <=, >, >=,
and equals(); plain numbers are wrapped as constants. Expression
equality is structural: == compares trees, while equals() builds a
comparison expression. Using an expression as a truth value raises
BindingError; evaluate it first. evaluate(bindings) computes the value
from a mapping of parameters to values, and free_parameters() returns
the set of parameters in the tree.
Definition · Expressions and binding
An expression is a constant, a parameter, or \(e_1 \circ e_2\) for expressions \(e_1, e_2\) and an operation \(\circ\). Its free parameters are \(\text{free}(c) = \emptyset\), \(\text{free}(p) = \lbrace p\rbrace\) and \(\text{free}(e_1 \circ e_2) = \text{free}(e_1) \cup \text{free}(e_2)\). A binding \(\beta\) is a finite map from parameters to values, and \(\text{bind}(e, \beta)\) is: the value \(e(\beta)\) if \(\text{free}(e) \subseteq \text{dom} \beta\); otherwise \(e\) itself if \(e\) is a parameter; otherwise \(\text{bind}(e_1, \beta) \circ \text{bind}(e_2, \beta)\). A plain value \(v\) has no free parameters and evaluates to itself.
Theorem · Partial binding
For every expression \(e\) and binding \(\beta\), (i) \(\text{free}(\text{bind}(e, \beta)) = \text{free}(e) \setminus \text{dom} \beta\), and (ii) for every binding \(\gamma\) with \(\text{dom} \gamma \cap \text{dom} \beta = \emptyset\) and \(\text{dom} \gamma \supseteq \text{free}(e) \setminus \text{dom} \beta\), \(\text{bind}(e, \beta)(\gamma) = e(\beta \cup \gamma)\).
Corollary · Binding in stages
For bindings \(\beta_1, \beta_2\) with disjoint domains, \(\text{bind}(\text{bind}(e, \beta_1), \beta_2)\) and \(\text{bind}(e, \beta_1 \cup \beta_2)\) have the same free
parameters and the same value under every binding of them. In particular
canvas.bind(p, 1).bind(q, 2) draws the same diagram as
canvas.bind({p: 1, q: 2}).
bind walks through tuples, mappings and every mosaickit dataclass, so a
whole scene is bound at once; a layer's model is left alone. Rendering a
scene that still has free parameters raises BindingError naming them.
from mosaickit import Canvas, Parameter, TextLayer

x = Parameter("x", value_type=float)
template = Canvas().add(TextLayer((x, 2 * x + 1), "moving"))
frame = template.bind(x, 3.0)
# (3.0, 7.0)
print(frame.snapshot().layers[0].position)
Grids
CanvasGrid(
    cells,
    rows=None,
    cols=None,
    shape=None,
    links=()
)
Span(
    canvas,
    rows=1,
    cols=1
)
Places several canvases in one figure. cells is either a flat list of
canvases, Spans and Nones (empty cells), filled row by row, or a list of rows,
where row spans are allowed and every row must account for every column.
shape=(rows, cols) is the same as passing both. Each canvas is copied,
so changing it afterwards does not change the grid. Overlapping spans,
spans past the edge, too many cells or mixed flat and nested cells raise
ConfigurationError. render() and save() work as on a canvas.
Proposition · Inferred grid shape
For a flat list of \(n \ge 1\) plain cells with neither rows nor cols
given, the grid has \(c = \left\lceil \sqrt\lbrace n\rbrace \right\rceil\) columns and \(r = \left\lceil n / c \right\rceil\)
rows. Then \(r c \ge n\), \(r \le c\), and fewer than \(c\) cells are left empty,
all in the last row.
With only cols given, \(r = \left\lceil n / c \right\rceil\); with only rows,
\(c = \left\lceil n / r \right\rceil\).
CanvasGrid.from_layout(canvases, layout)Common arrangements: SINGLE, STACKED (two rows), SIDE_BY_SIDE,
GRID_2X2, GRID_3X3, and the three-canvas TOP_TWO_BOTTOM_ONE and
TOP_ONE_BOTTOM_TWO, whose single canvas spans both columns.
CanvasGrid.sweep(
    template,
    values,
    *,
    cols=None
)
Creates one cell for each value in the supplied ParameterValues, with the
template bound to that value.
GridLink(
    start_cell,
    start,
    end_cell,
    end,
    role="link",
    stroke=None
)
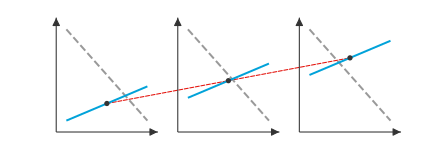
A straight line from start in one cell to end in another, each in its
own cell's data coordinates, drawn over the figure across the gaps between
cells. Cells are numbered in placement order. Its style is role
resolved in the start cell's theme, with stroke on top. A cell index out
of range raises ConfigurationError when the grid is built.
from mosaickit import (
    Canvas,
    CanvasGrid,
    GridLink,
    MarkerLayer,
    Parameter,
    Stroke,
)

shift = Parameter("shift", value_type=float)
template = Canvas().add(MarkerLayer([(5, 2.5 + shift)]))
cells = [template.bind(shift, v) for v in (0.0, 2.0, 4.0)]
link = GridLink(
    0, (5, 2.5), 2, (5, 6.5), stroke=Stroke(dash="dashed")
)
CanvasGrid(cells, cols=3, links=[link]).save("sweep.pdf")
Animation
Creates one frame per value by binding the parameter in the template.
frames() yields the frames as renderer-neutral scenes; save(path)
writes a GIF (through Pillow) or an MP4 (through ffmpeg). The values are checked
against the parameter when the animation is created; an empty list or a
non-positive fps raises ConfigurationError.
from mosaickit import Animation

values = shift.values([0.0, 1.0, 2.0, 3.0])
Animation.sweep(template, values, fps=4).save("sweep.gif")