Themes
Themes control all colours and stroke widths used by the Canvas.
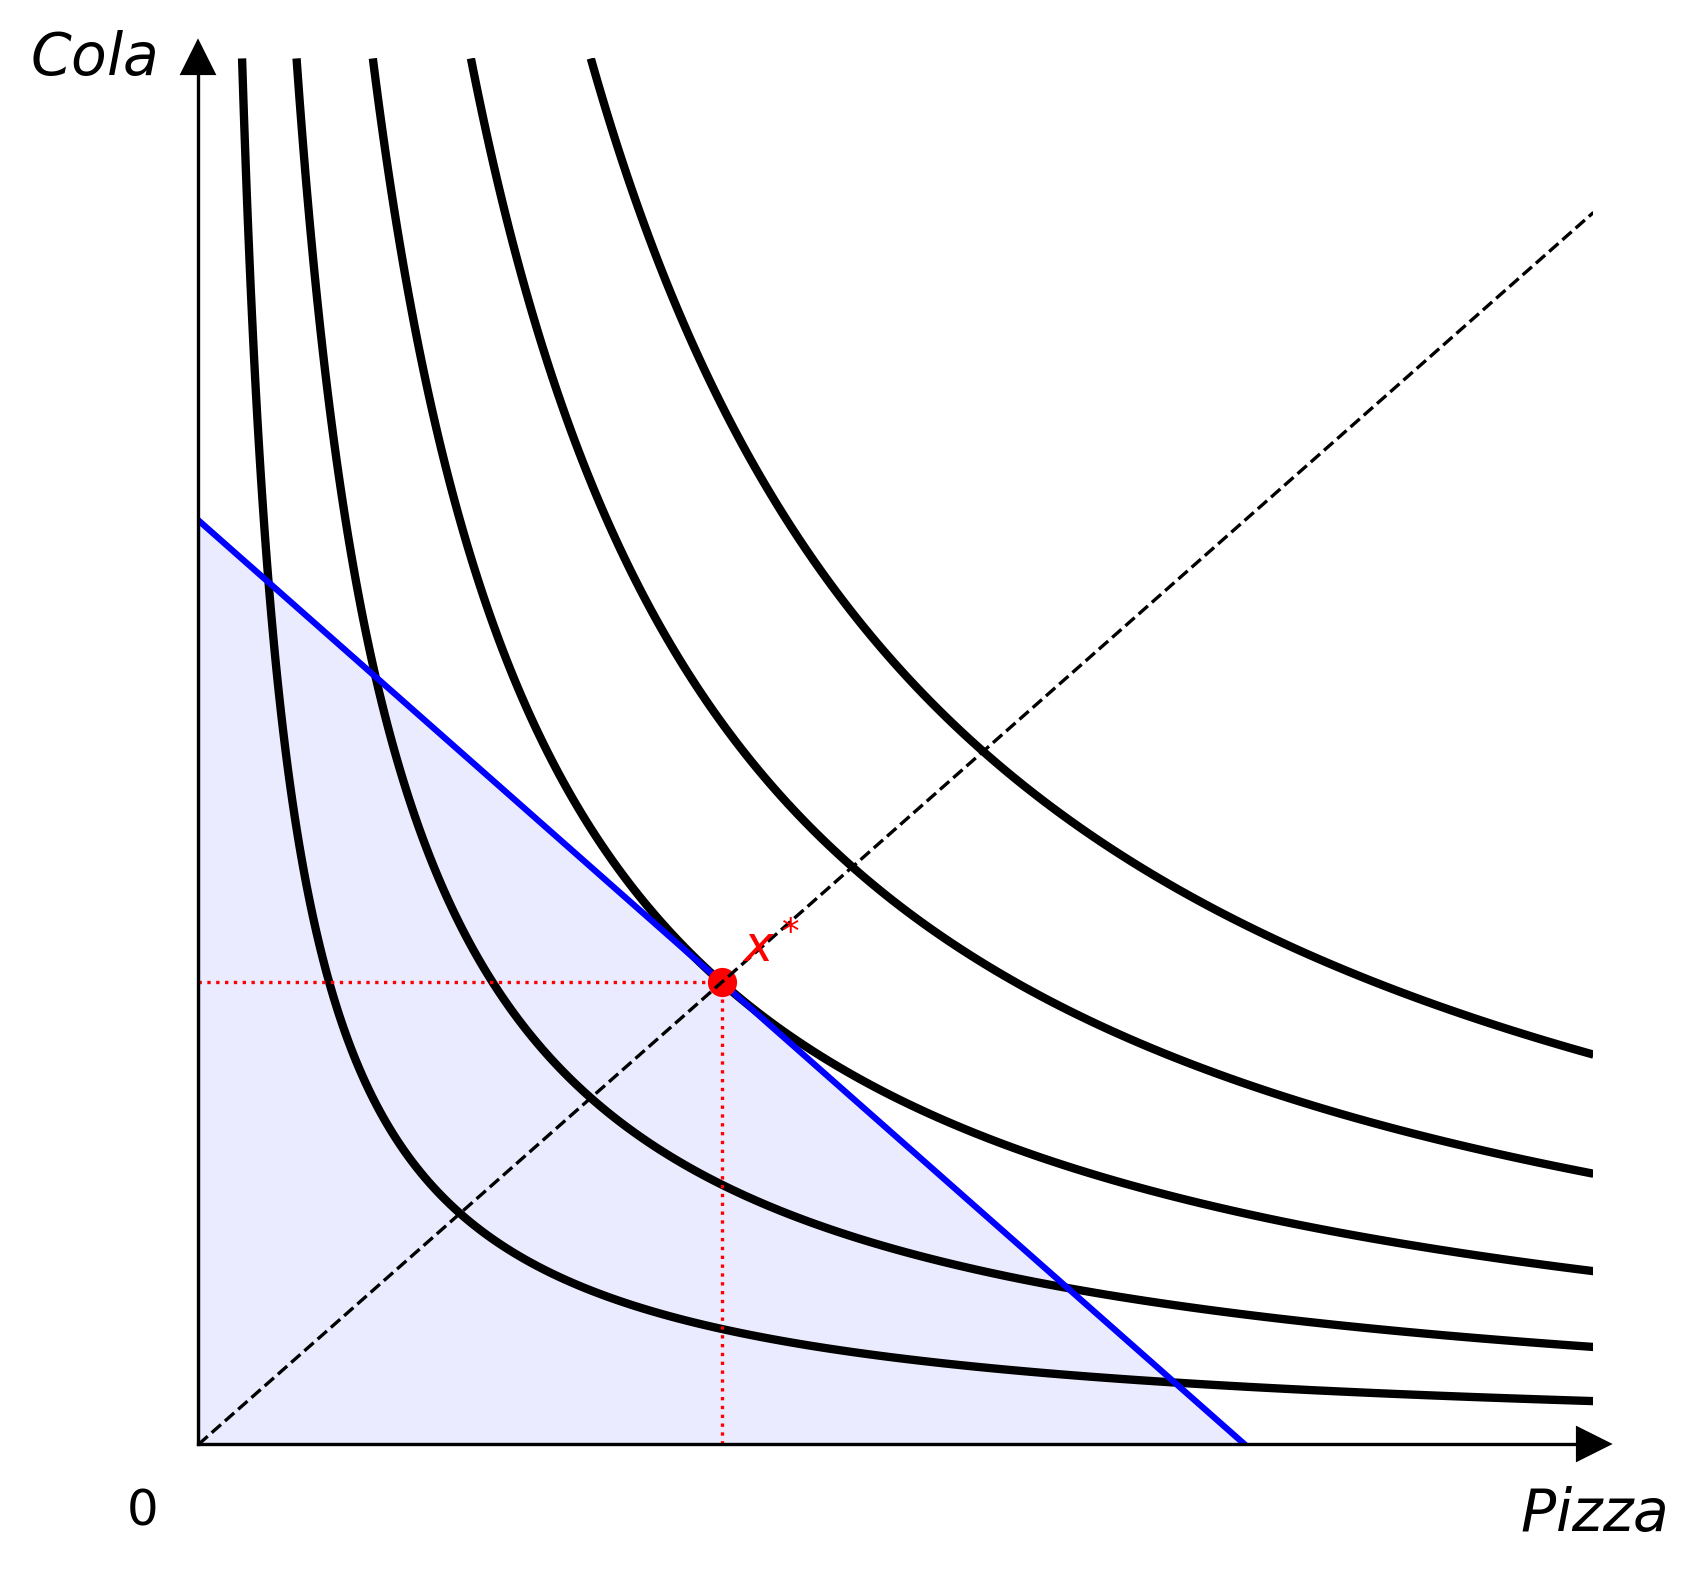
Built-in themes
Default
The default theme draws from a colour-blind-friendly colour cycle
(thriveth, 2014), exposed as themes.COLORBLIND_CYCLE_HEX and
themes.COLORBLIND_CYCLE_RGB. Economics teaching relies heavily on graphs, so
colour alone should not carry meaning for students with impaired vision
(Kugler & Andrews, 1996).
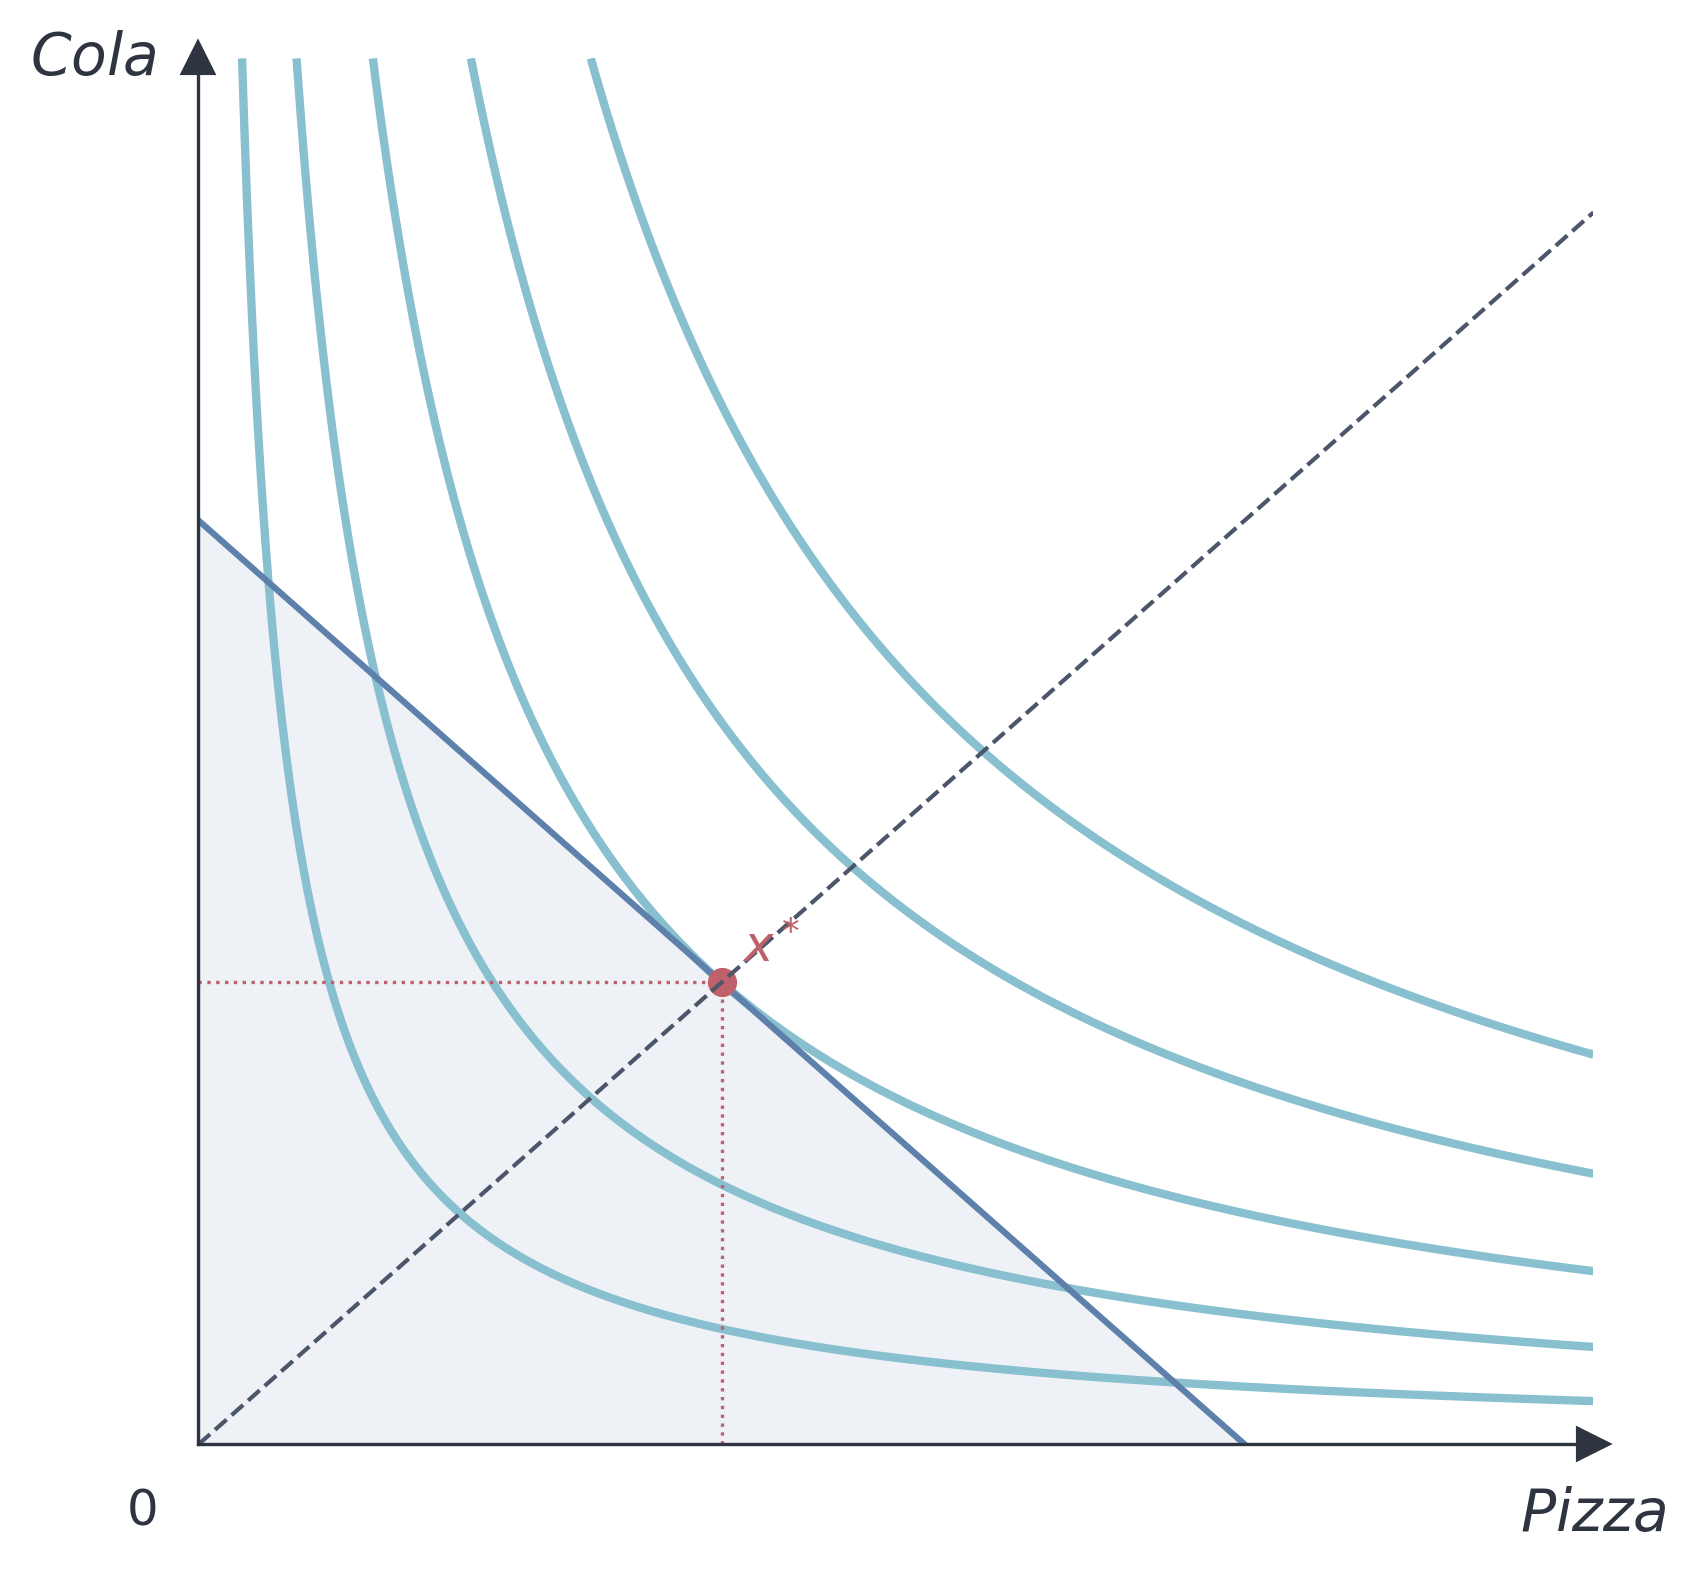
Nord
The Nord theme uses the Nord colour palette — cool blues and muted tones suitable for academic presentations.
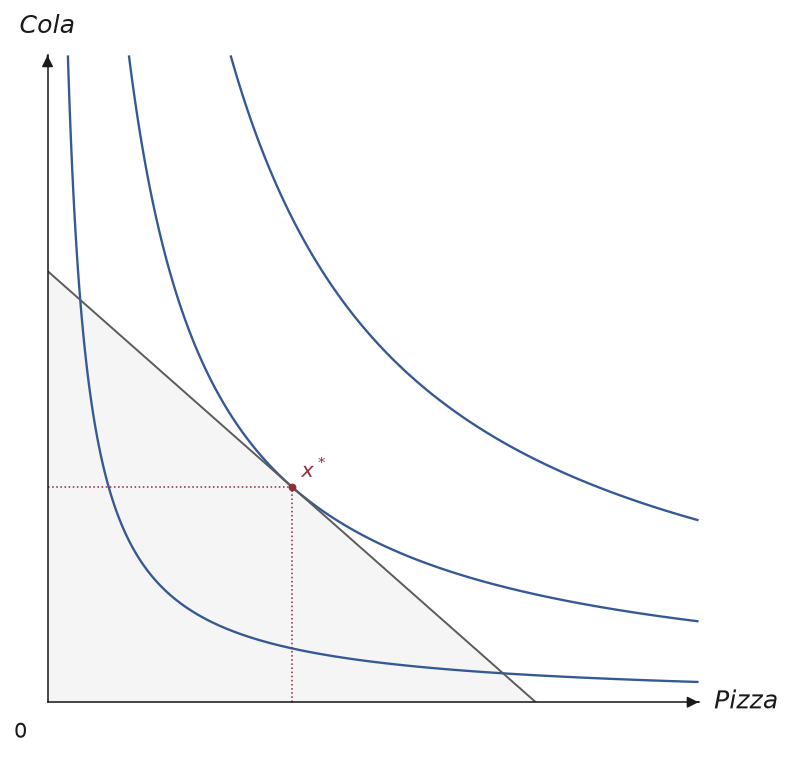
Paper
The paper theme uses thinner lines, smaller markers, and restrained typography on a transparent background — suitable for print and journal figures where ink and space are at a premium.
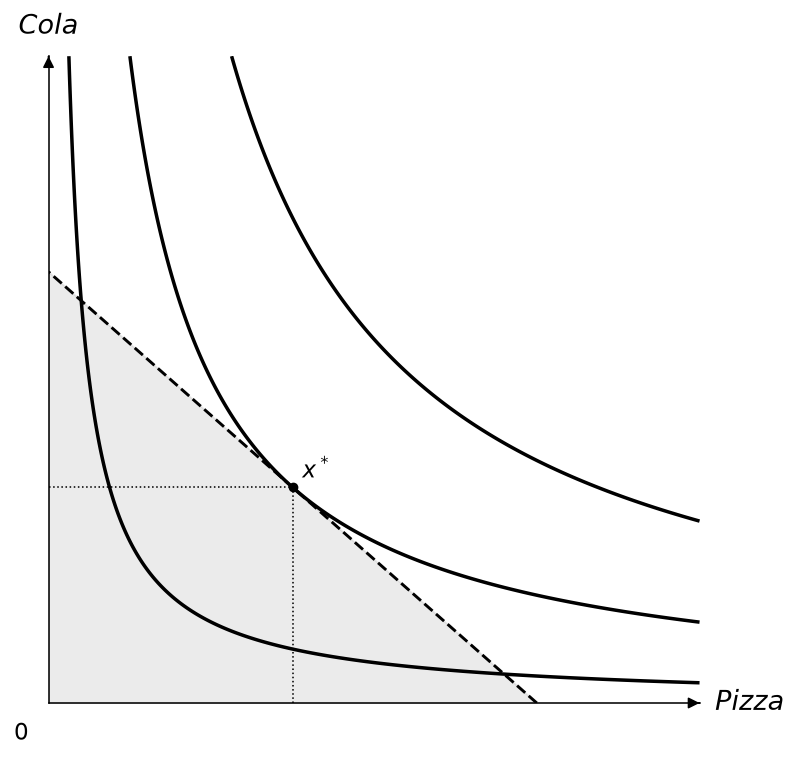
Monochrome
The monochrome theme drops colour entirely — every element is a shade of gray — and instead distinguishes curves, budget lines, and rays by line style, and markers by shape. Suitable for black-and-white printing or figures viewed by colour-blind readers without relying on colour at all.
Presentation
The presentation theme uses larger text, thicker lines, and bigger markers for visibility on a projector screen or in a lecture hall.
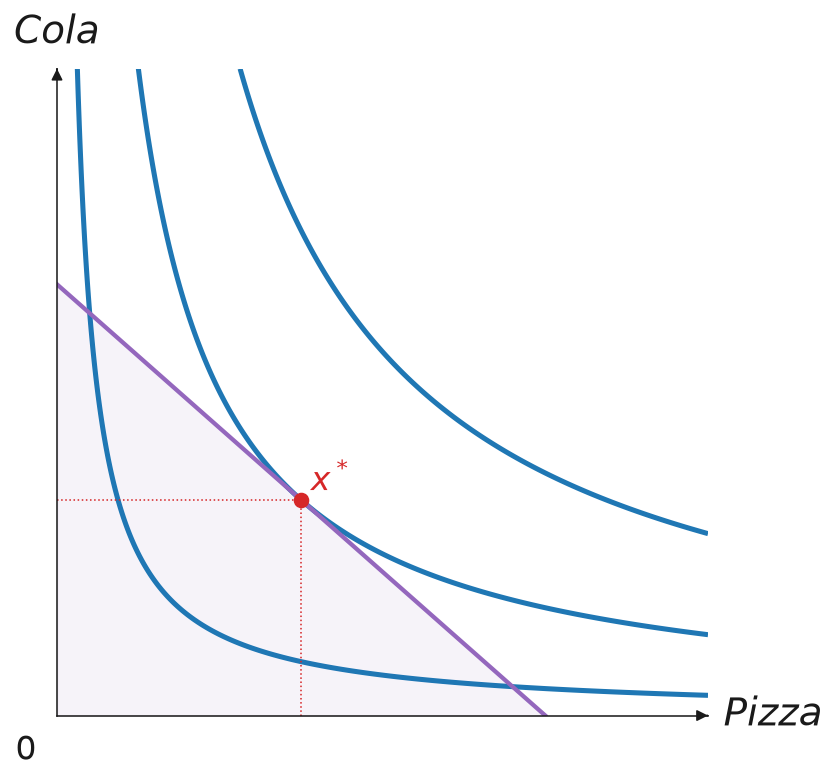
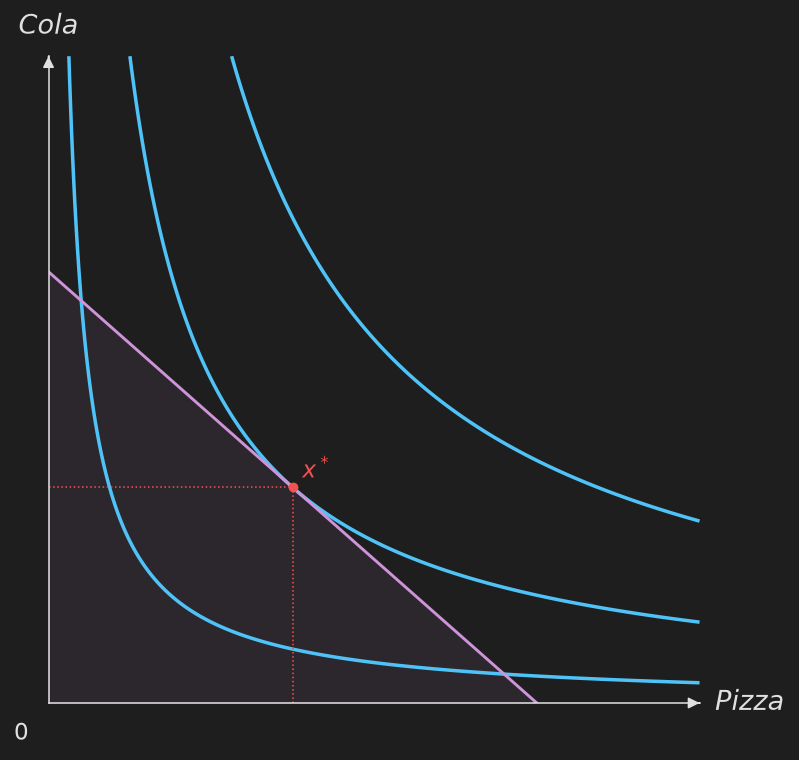
Dark
The dark theme uses a dark background with light foreground colours, suitable for dark-mode slides or websites.
Custom theme
Pass any field to the constructor to override just that value; everything else keeps the built-in default:
from econ_viz import Theme

my_theme = Theme(
    name="custom",
    axis_color="#333333",
    label_color="#333333",
    ic_color="#2563eb",
    ic_linewidth=1.5,
    budget_color="#dc2626",
    eq_color="#16a34a",
    eq_markersize=6.0,
)

cvs = Canvas(x_max=20, y_max=15, theme=my_theme)
Every line, marker, fill, label, and legend a diagram draws also has a
composite default -- theme.ic_stroke, theme.eq_marker, theme.point_label,
and so on -- built from the fields above. To change one of these as a whole
(for example, giving the core segment of an Edgeworth box its own arrowhead,
not just its own colour), subclass Theme and override the property:
from econ_viz import ArrowStyle, Stroke, Theme

class MyTheme(Theme):
    @property
    def core_stroke(self) -> Stroke:
        return Stroke(width=3.0, color="#C0392B", arrow=ArrowStyle.TRIANGLE)

cvs = EdgeworthBox(..., theme=MyTheme(name="my-theme"))
Passing an explicit argument to a method (add_core(stroke=...)) still wins
over the theme, and the theme still wins over the built-in default -- the
same precedence a settings file follows.
Theme fields
| Field | Description |
|---|---|
name |
Theme identifier |
axis_color |
Colour of axis spines and arrow tips |
label_color |
Colour of axis and origin labels |
ic_color, ic_linewidth |
Indifference-curve stroke colour and width |
secondary_ic_color, secondary_ic_linewidth, secondary_ic_opacity |
Subdued curves shown beside a highlighted focal utility level |
path_color, path_linewidth |
PCC / ICC path stroke colour and width |
budget_color, budget_linewidth |
Budget-line stroke colour and width |
budget_fill_alpha |
Opacity of the feasible-set shading |
eq_color, eq_markersize |
Equilibrium marker colour and size |
ray_color, ray_linewidth |
Expansion-path ray colour and width |
kink_color |
Kink-point marker colour |
sub_effect_color, inc_effect_color |
Substitution- / income-effect arrow colours |
effect_arrow_linewidth |
Effect-arrow width |
compensated_budget_color, compensated_budget_linewidth, compensated_budget_linestyle |
Compensated budget line in a decomposition |
subsistence_color, subsistence_linewidth |
Stone-Geary subsistence reference lines |
contract_color, contract_linewidth |
Edgeworth contract curve |
core_color, core_linewidth |
Edgeworth core segment |
price_color, price_linewidth |
Edgeworth price line |
walrasian_color, walrasian_markersize |
Edgeworth Walrasian equilibrium marker |
axis_stroke, drop_stroke, projection_stroke, guide_stroke, box_stroke |
Lines with no separate colour/width fields of their own |
Style properties
Every property below is a Stroke, Marker,
Label, Fill, or Legend,
built from the fields above. Overriding one in a subclass changes every
diagram that doesn't pass its own explicit argument for that role; the
settings file sets the same properties from [stroke.<name>],
[marker.<name>], [label.<name>], and [fill.<name>] sections.
| Kind | Properties |
|---|---|
| Stroke | ic_stroke, secondary_ic_stroke, budget_stroke, ray_stroke, path_stroke, compensated_budget_stroke, final_budget_stroke, substitution_stroke, income_stroke, subsistence_stroke, contract_stroke, core_stroke, price_stroke, axis_stroke, drop_stroke, projection_stroke, guide_stroke, box_stroke |
| Marker | eq_marker, point_marker, kink_marker, bliss_marker, path_marker, core_marker, endowment_marker, walrasian_marker |
| Label | axis_label, origin_label, title_label, box_label, effect_label, point_label, bundle_label, bliss_label, ic_label, edgeworth_label |
| Fill | budget_fill |
| Legend | legend |